How Trump’s Tariffs Rocked Markets — And What Crypto Did Next
Since February 2025, President Trump’s escalating tariff announcements have sent shockwaves through global markets. From initial levies on Canada and Mexico to sweeping tariffs affecting 57 countries, each policy shift has triggered significant volatility across equities, cryptocurrencies, and commodities.
Below is a timeline of key tariff-related events, market reactions, and the BTC price swings they triggered.
📆 Timeline of Trump Tariff Announcements vs Market Reactions
Here’s a snapshot of the most volatile days:
| 📅 Date | 🗞️ Announcement | 📉 S&P 500 | ₿ Bitcoin | 🪙 Altcoins | 🏆Gold |
|---|---|---|---|---|---|
| Feb 1 | 25% tariffs on Canada/Mexico; 10% on China | N/A | -3.0% | -12.0% (XRP, SOL, ETH hardest hit) | ~$2,540 |
| Mar 12 | 25% global steel/aluminum tariffs | -1.5% | -1.5% | -3.0% | ~$2,780 |
| Apr 2 | Emergency tariffs: 10–54% on 57 countries | -3.4% | -10.0% | -25.0% (market cap halved) | ~$3,167 |
| Apr 3–4 | Enforcement begins, then recession panic. Aditional tariffs on Israel and Vietnam | -4.88% → -5.97% | -5.0% | -10% to -15% more (Coinbase down 7.7%) | ~$3,004 |
| Apr 9 | Tariff pause; 25% auto tariffs (China at 125%) sparks rally | +9.52% | +8.0% | +10.0% (XRP, SOL rebound strongest) | ~$3,245 |
| Apr 10 | Market digests pause; no new announcement | -2.5% | -4% | -5% | ~$3,180 |
| Apr 14 | Exemptions for electronics (Apple, etc.) | +0.79% | +1.5% | +3.0% (tech-linked alts benefit e.g., Apple shares) | ~$3,212 |
| Apr 22 | Gold hits record high amid market uncertainty | +0.5% | +2.0% | +4.0% | $3,500 (intraday) |
Note: Gold and silver prices are approximate and based on available data.
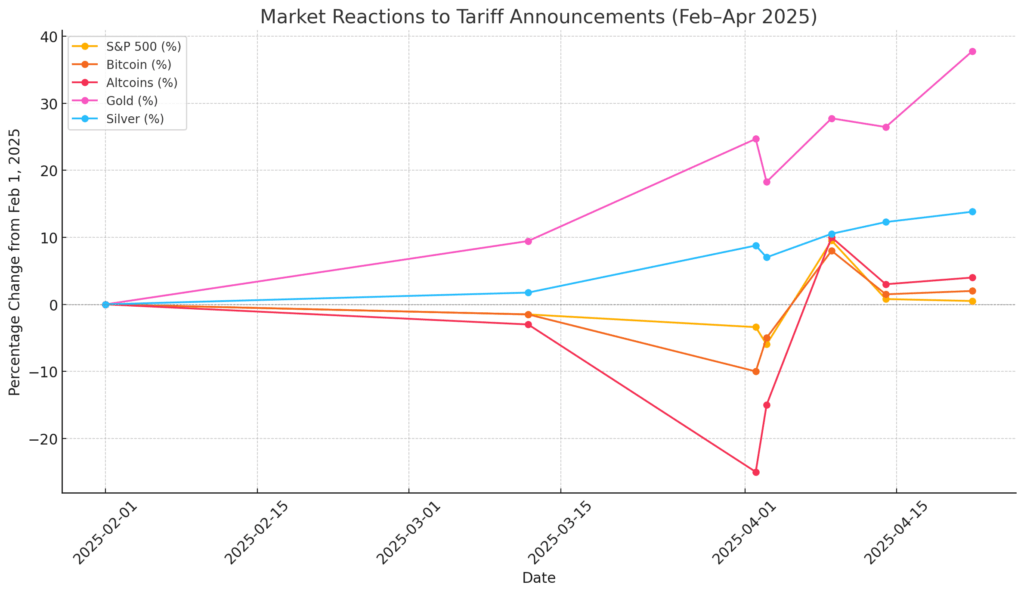
📊 Visualizing the Chaos
The chart below shows the parallel trajectory of the S&P 500 and Bitcoin through the turbulence of Trump’s trade moves:
🔶 Bitcoin declined across most announcements until the April 9 pause triggered a sharp relief rally.
🔷 The S&P 500 saw sharper daily percentage drops than Bitcoin, highlighting the broad risk-off sentiment.
🟡 Gold held its ground — and then rallied hard — as safe-haven demand returned.
🪙 Altcoins exhibited the most volatility, with sharp losses and rebound attempts tied to macro sentiment.
What This Shows Us
🧯 Crypto ≠ Hedge (At Least Not Short-Term)
Bitcoin mirrored equities more often than not, suggesting that macro fears — like sudden tariff escalations — continue to pull crypto into broader market turbulence.
🎭 Policy Uncertainty Wrecks Confidence
Markets don’t just fear bad news — they fear unpredictability. The Trump strategy of announcing, delaying, then doubling down created persistent anxiety, which hit all asset classes hard.
🕊️ Pause = Relief
The April 9 policy pause was met with immediate risk-on appetite. Stocks, Bitcoin, and altcoins all posted strong gains — highlighting just how starved markets were for clarity.
🧪 Asset Highlights
- Altcoins & XRP: Highly sensitive to macro narratives. Saw deep losses on Feb 1 and Apr 2, but also led in rebounds post-pause.
- SOL: Frequently among the hardest-hit but also one of the fastest to recover, especially in bullish pockets like Apr 9–14.
- Apple & Tech Stocks: Benefited from exemptions. Their recovery lifted tech-linked altcoins and improved sentiment across risk assets.
- Ondo Finance: Outperformed many majors during volatility. The RWA narrative continued to resonate as TradFi institutions looked for yield-bearing digital instruments.
- Coinbase (COIN): Declined sharply on Apr 3 as fears around U.S. policy spillover weighed heavily on publicly traded crypto firms.
🔭 Where Do We Look From Here?
1. Macro-Driven Markets Are the New Normal
Gone are the days when crypto danced to its own beat. The correlation between equities and crypto is tighter than ever — especially in the face of unpredictable geopolitical and trade policies. When Trump speaks, crypto bleeds, just like stocks.
2. BTC is Resilient, Alts Are Risk-On Bets
Holding alts continues to reflect high-volatility exposure to global risk sentiment. Bitcoin may bounce back after 10% drops, but alts often need coordinated bull runs or macro relief to fully recover.
3. Narrative Is Everything
Projects like Ondo and tokenized real-world asset (RWA) platforms showed signs of strength even during the turbulence. Safe yield and TradFi-linked infrastructure might emerge as the next defensive play in crypto.
🧩 Lessons Learned
- Announcements punch first — policy plans are often priced in before they take effect.
- Delays still sting — the Feb 1 to Mar 4 window saw markets fall before the actual implementation.
- Watch for pivots — April 9’s sudden pause reversed days of damage.
- Diversification matters — BTC declined 3–10%; alts dropped 10–30%. Risk tolerance is more important than ever.
🧭 Navigating the Tariff Pause
The current 90-day pause on escalations gives markets some breathing room. But if this cycle has shown anything, it’s that traders today need to be macro-aware, responsive, and measured. Crypto is no longer isolated — it’s macro-attached.
🌅 Is a Bitcoin Decoupling on the Horizon?
While Bitcoin has largely traded like a risk asset during recent macro shocks, its long-term fundamentals — such as fixed supply, decentralized settlement, and increasing adoption by sovereigns and institutions — may lay the groundwork for future decoupling. As traditional markets face growing debt burdens and monetary interventions, Bitcoin’s digital scarcity could start to resonate more like gold than tech — especially if the demand for neutral, self-custodied assets rises in politically volatile environments.
🏆 Gold: The Traditional Safe Haven
Gold’s climb from ~$2,540 to $3,500 during this window reinforces its role as a traditional hedge. But it’s worth noting that the paper-to-physical gold ratio (sometimes exceeding 100:1) raises questions about how accurately markets price real demand — especially in a crisis. Structural fragility could still impact how gold performs in future market stress.
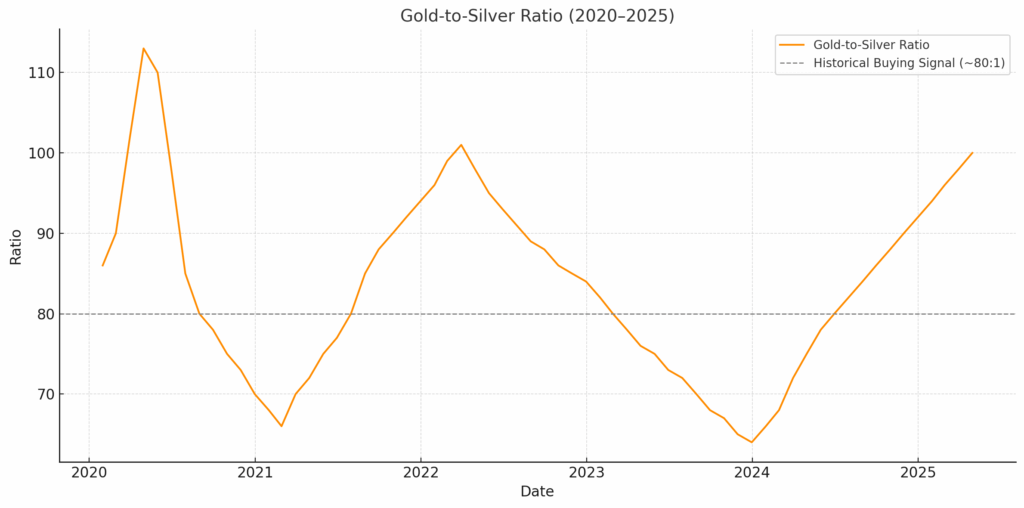
🥈 Silver: The Underestimated Play
While less discussed, silver posted meaningful gains in tandem with gold. With gold peaking, one key metric to watch closely is the gold-to-silver ratio — currently near historically high levels. When this ratio stretches (e.g., 80:1 or higher), it has often marked strong buying windows for silver. Historically, silver tends to play catch-up in late-stage commodity rallies, offering outsized upside when capital flows rotate from gold into undervalued metals.
Here’s a historical chart of the Gold-to-Silver ratio from 2020 to 2025, highlighting how we’re again near the 80–100 range — a zone that has often preceded strong silver rallies.